


Good News and Bad News. Sideways Price Action Beats Volatility-Mageddon. Don’t Hold Your Breath on the Fed.
Two Stocks Worth Considering in an uncertain market.


Image courtesy of https://www.newtraderu.com/
I have good news and bad news. The good news is that the market has settled into a less volatile trading pattern that is, in some ways, easier to manage. The bad news is that rallies are fickle and so far, have failed to gain major traction. All of which suggests that barring a retest of the new lows, we may continue to move sideways until the Fed eases rates.
Don’t hold your breath. A more likely scenario, barring some sort of textbook recession scenario, is that value seeking traders will eventually boost this market in the short to intermediate term
That means that investors are on their own. And that means keeping position sizes small and adding small lots to the best performers in the portfolio when they pull back slightly and slowly rebuilding a high quality portfolio.
On the other hand, if you’re willing to dig far enough there is a steady increase in the number of stocks which are worth considering.
A Tale of Two Stocks
Recently I closed out a two part tactical trade featuring Palantir (PLTR), which delivered $870/100 shares in five days. I recommended part of the allocation to the aggressive leg (described in the prior link) while the second leg offered guidance on building a longer term position in the stock, which by the way is still open. And yes, I own shares in PLTR.
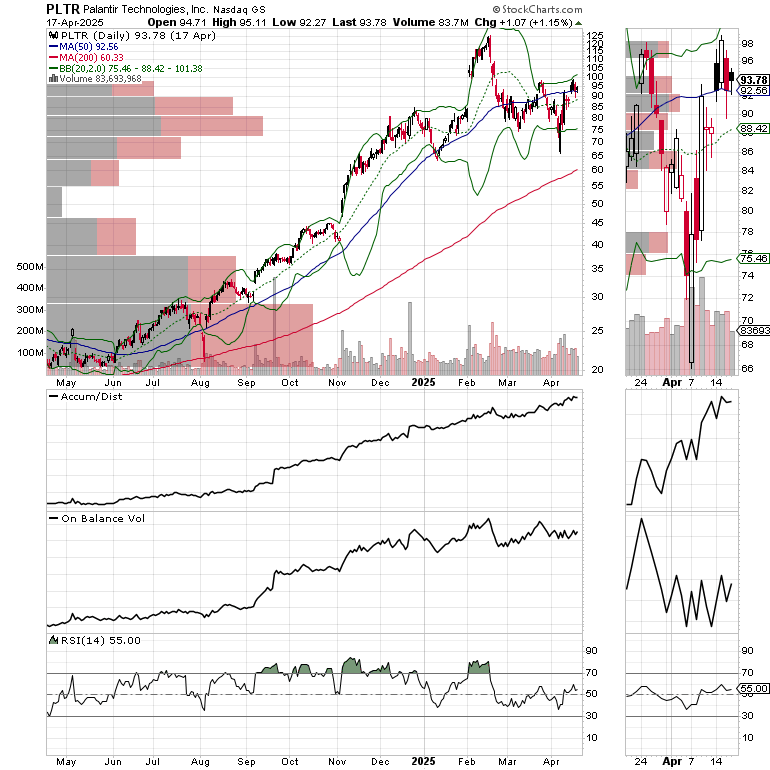
PLTR is holding steady near its 50-day moving average with steady money flows into the shares (ADI is rising while OBV is holding steady). Thus, a move above $98 could take it back toward its recent highs.
I also own and have recommended owning shares in homebuilder D.R. Horton (DHI) in my very long term focused Rainy Day Portfolio, which resides in the Weekender Portfolio. Certainly, DHI is no momentum stock as the action in the housing market speaks for itself. Still, even after another quarterly earnings miss, DHI recently rallied.
Net sales fell but revenues beat expectations. Backlogs and orders also fell. On the other hand, the company gave better than expected guidance for Q3 while noting, during the conference call that the sales pace for March and April outpaced the February pace. Thus, the rally in the stock.
DHI - Early and Hopeful Signs of a Turnaround
Details matter. In a bad quarter, DHI still had $7.7 billion in revenues and net income of $810 million with gross margins of 21.8% and nearly $2.5 billion of cash on its balance sheet. Moreover, it announced a new share buyback plan of $5 billion, which didn’t hurt the price of the shares.
The homebuilders are going through a rough period. Yet, the structural nature of the housing shortage still puts them in a favorable position if they can hang on until the cycle turns back in their favor. That, of course, entails savvy management of the business. Indeed, because of improved building efficiency, the judicious use of incentives, and able inventory management the homebuilders still have room to maneuver, as DHI’s revenue beat illustrates. Moreover, with housing starts falling regularly now, on a monthly basis, that will perpetuate the positive supply/demand scenario which allows DHI to deliver $810 million in net income during a bad quarter.

DHI remains near its recent low but is at an attractive P/E of less than 10 while paying a modest dividend of $1.60/year (1.4%). In other words, it’s a stock that you nibble at, buying a few shares here and there as long as the shares don’t break to new lows. Note that both the ADI and OBV lines are sporting quiet uptrends. That’s a sign that value players are nibbling.
Bottom line. In this market, you’ve got to find both short term opportunities while balancing them out with value plays. For ideas on the homebuilder stocks check out the ESP Portfolio, and the Weekender Portfolio.
Liquidity Watch - Conditions Tighten Further
Liquidity is tightening, which continues to explain the stock market’s wild swings. The latest reading, April 11, 2025, of the Fed’s National Financial Conditions Index (NFCI) came in at -0.42 rising from the prior week’s -0.54, well off the recent lows at -0.67. Negative numbers signify ample liquidity. Yet, the nearly 10-plus basis point rise over four weeks is cautionary and at least partially explains the general weakness in stocks.
Sentiment Summary – Panic Gives Way to Some Relief
• The CNN Greed/Fear Index (GFI) closed last week at 21. This remains a bullish Extreme Fear Reading.
• The Composite Put/Call Ratio closed at a moderately bullish 0.89. The index P/C ratio closed at 1.25, down from the high of 1.40 two weeks ago. This is still a bullish contrarian reading.
• The CBOE Volatility Index (VIX) closed at 29.65 after rising above 50 over the last couple of weeks. This suggests that there is less selling pressure in the market.
• The S&P 500 (SPX) is off its worst levels but may not be out of the woods. Check out this post for full details its recent travails).
• The bond market has calmed down but remains a wildcard.
Bollinger Bands Suggest Volatility is Dying Down
The relationship between the S&P 500 (SPX) its 200-day moving average and multiple standard deviations (SD) Bollinger Bands (2SD, 3SD, and recently the 4SD) is showing signs of stabilizing. That’s a big deal as it could be signaling that the recent helter skelter market has calmed down. Moreover, as I noted here in full detail, the market’s current action is very similar to what we saw in 2020. That’s important because the March/April 2020 market bottom was the beginning of an 18 month – plus bull run.
When prices touch or break above the upper Bollinger band, or touch or fall below the lower band, it signals a potential price reversal. A tag of 2SD is considered “normal” behavior. A tag of 3SD, and 4SD are extraordinary. A reversal may be to a short/intermediate term support/resistance level such as the 50-day moving average, to a long term moving average, such as the 200-day, or in extreme cases to the opposite Bollinger Band or beyond.

SPX came close to tagging, or breaking above the upper green band in July 2023, March, August, October, November and December of 2024. Each tag of the upper band led to a reversal, usually to the 50-day moving average. This testified to the strength of the bull market as the 50-day line proved to be an excellent place to buy the dip.
The pattern changed with the December 2025 tag of the upper BB. After that we saw a double top in February 2025 and the subsequent break below the 50-day moving average and the 200-day line.
Yet, by last week’s end SPX was trading inside the green band (2DS), closing inside the band to end the week. The next positive moves would be a successful move above the 50 and 200-day moving averages. Note that the ADI line fell on Friday as investors hedged via short sales and put options over the long weekend. Yet, the OBV line moved up, a sign that dip buyers were active. This divergence may be setting up a short squeeze.
Bond Yields Retrace Violent Surge
The bond market rolled over last week after the prior week’s violent yield tantrum, which some observers attributed to China selling portions of the U.S. Treasury holdings.

The U.S. Ten Year Note yield (TNX) ended the week near 4.3.5, well below the 4.5%- plus it registered the prior week.
If you’re an ETF trader, consider, Joe Duarte’s Sector Selector. It’s FREE with your monthly membership to Buy Me a Coffee. If you’ve been thinking about starting a day trading career, my new book “Day Trading 101” will get you started on the right foot. For steady gainers, check out the Smart Money Weekender Portfolio. I’ve just added several new positions in this weekend’s edition. Trade better with extra energy, and vitality. Visit my Health Products Page.
NYAD and Major Indexes Deliver Mixed Performance.
The New York Stock Exchange Advance Decline line (NYAD) followed through after its recent reversal, closing the week just below its 20-day moving average. The prior week NYAD registered an oversold reading of 30 on the RSI indicator forecasting a rebound. The 200-day moving average is the next upside test.

The Nasdaq 100 Index (NDX) remains in a downtrend with resistance at the 20-day moving average. We may see some more choppy trading here over the next few days to weeks. A move above 20,250, if it holds, would signal a return to a more sustainable uptrend.

The S&P 500 (SPX) is discussed above.
VIX Rolls Over - A moderate positive sign.
The CBOE Volatility Index (VIX) topped out above 50 recently, a climactic selling panic. Over the last two weeks it has receded below 30. This is a positive for now.
VIX rises when traders buy large volumes of put options. Rising put option volume leads market makers to sell stock index futures to hedge their risk and leads markets lower. A fall in VIX is bullish signaling lower put option volume, eventually leads to call buying which is bullish as it causes market makers to buy stock index futures raising the odds of higher stock prices.
To get the latest up to date information on options trading, check out “Options Trading for Dummies”, now in its 4th Edition – Available Now!

#1 Best Seller in Options Trading –
Now in Audible Audiobook Format
Options Trading for Dummies (4th Edition) Audible Audiobook – Unabridged
Joe Duarte MD (Author), Terrence Kidd (Narrator), Tantor Audio (Publisher)