


How Many More Lives do the Morris the Cat Stock and Bitcoin Markets Have Left?
Stocks and Bitcoin Hold the Key to the Economy.


Image courtesy of i.pinimg.com
The last hour of trading on Friday was encouraging and could be a sign of better things to come. The market was clearly getting oversold. Yet, even after the late day recovery last week’s tech, large cap, and Bitcoin massacres left investors resembling a battered and bruised version of the clever and curmudgeonly Morris the Cat, whose “Nine Lives” commercial escapades propelled him to feline stardom. And while Morris’ adventures always ended well, in the real world, the big question for investors is home many lives did the recent selloff cost the bull markets in both stocks and Bitcoin?
Next week’s employment data and whatever happens in the geopolitical and inside the Beltway arenas will contribute to the market’s developments.
The Stock Market holds the key to the Economy
Last week’s market’s troubles were multifactorial. Certainly, the ongoing geopolitical/tariff/Washington histrionics contributed, along with recent data: consumer confidence and housing data in particular. Even the Atlanta Fed’s GDP-Now model is turning negative, with its latest reading forecasting GDP growth of -1.5%.
This is spurring talk of an “impending” recession. Yet, the prevailing market zeitgeist fails to factor in a crucial point. That’s because money behaves differently in the post pandemic world.
As I’ve put forth here many times, the role of the financial markets, mostly stocks and Bitcoin, are sadly ignored. Stocks and cryptos are crucial because more people than ever depend on the financial markets for spending money. Thus, bull markets create wealth (albeit paper wealth), which can be deployed into tangible purchases and bear markets reduce wealth which reduce purchasing power. I call it the MELA System, where M stands for markets, E for Economy, L for life decisions, and A for algos.
The short version is that when stock (and to a lesser, yet tangible effect) crypto prices are rising, people spend more, and the economy is boosted as the velocity of money (the number and frequency of transactions) increases. This, in turn, improves corporate earnings which juice stock prices and the virtuous cycle is enhanced.
In essence, because the global economy is based on debt, it has become dependent on profitable transactions which enhance cash flow. Bull markets improve the odds of individuals and companies achieving positive cash flows.
My point is that, contrary to mainstream perception, if the stock market weakens much further, on top of Bitcoin’s recent crash, the odds of an economic slowing will increase as market propelled consumers (traders and investors) will likely pull back their horns, money’s velocity will slow, positive cash flow will be reduced or turn negative, and it will become more difficult to service the ever present pile of debt. This is your recession.
All of which brings me to the most recent PCE number, which came in as expected and suggests that the rate of inflation’s rise may be flattening out.
Bond Yields Sink. Betting on Recession?
The bond market is all-in on the recession vibe as yields recently hit their lows for 2025.

The U.S. Ten Year Note yield (TNX) is now testing its 200-day moving average with a potential move below 4.25% in the works as bond traders are betting on a recession, which if history holds up would also reduce inflation. The RSI for TNX, however, is near 30, which means that the current move is getting overextended and could pause or reverse.
Panic Vibe Quickens
Here is the market’s current background:
• The CNN Greed/Fear Index (GF) closed the week in the Fear area, closing at 20, after falling as low as 16 last week, signaling that investor Fear is Extreme. This is bullish from a contrarian standpoint and compares to an Extreme Greed reading 76 a year ago and a reading of Fear (36) a month ago. Markets rarely descend into long term bear trends during periods of high fear.
• The Put/Call ratio has been rising lately, closing at 0.92, a cautious reading. The recent high for CPC was just above 1.0 in early 2025. The prior meaningful market bottoms, which led to long term rallies followed P/C ratios of 1.25 (8/24) and 1.30 (11/24). A sudden peak in this indicator could again signal a market bottom.
• The New York Stock Exchange Advance Decline line (NYAD, recently delivered a single new high and has remained in a consolidation pattern above its 50-day moving average.
Bottom line: Expect continued volatility and stay alert.
Make or Break Time Approaches
The recent selloff pushed key market gauges to major decision points. One is the Invesco QQQ Trust (QQQ) where the large cap tech stocks are heavily weighted. QQQ is now oversold with an RSI of 30.
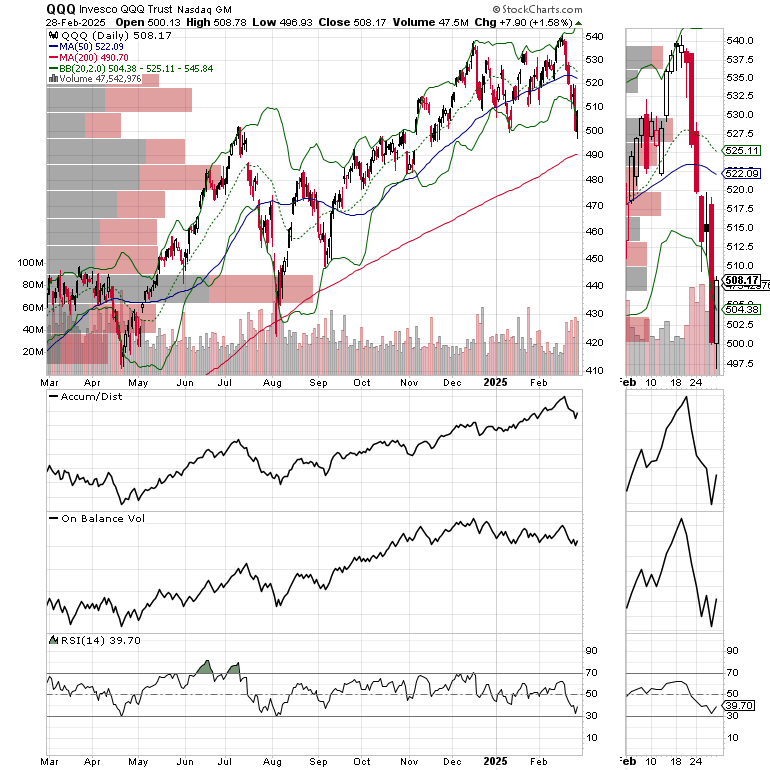
Moreover, its recent move below its Bollinger Band suggests that some sort of bounce is in the offing. Certainly, a nice rebound would soothe rattled nerves. Yet, more important is whether QQQ can 1) hold above its 200-day moving average near $490 and 2) eventually move back above its 50-day moving average.

Equally worthwhile is the action in the iShares U.S. Real Estate ETF (IYR), which has benefited from the recent decline in bond yields. IYR is in the midst of a steadily rising pattern and is testing the key $98 price area. You can see the large VBP bar in the area. A move above $98 could spur IYR steadily higher. I own a small position in IYR. The Weekender Portfolio has several open positions in excellent individual REITs. For more on ETF trading and investing, check out the Sector Selector Portfolio.

Finally, the iShares Home Construction ETF (ITB) looks listless, failing to bounce even after the most recent decline in TNX. That’s a sign of a complete loss of hope in the homebuilder stocks. And that, of course, may turn out to be very bullish, as I discussed in detail here.
Liquidity Remains Stable; Slightly Easier.
Liquidity, the ease with which money travels through the financial system is the key to bull and bear markets. When liquidity is ample, markets tend to rise. When liquidity is scarce markets don’t do well. The Federal Reserve’s National Financial Conditions Index (NFCI) is a readily available tool which indirectly shows us the state of liquidity in the markets.
A decline in the weekly NFCI number indicates that the ease with which money can be borrowed is rising. Last week, NFCI fell to -0.67 from last week’s -0.65). This remains positive for stocks.
Bitcoin Remains Messy
Bitcoin (BTCUSD) finally broke down. Yet the selling is well overdone, and some sort of bounce is in the works. Watch the 200-day moving average for clues.

If you’re an ETF trader, consider, Joe Duarte’s Sector Selector. It’s FREE with your monthly membership to Buy Me a Coffee. Sign up here. If you’ve been thinking about starting a day trading career, my new book “Day Trading 101” will get you started on the right foot. For steady gainers, check out the Smart Money Weekender Portfolio. I’ve just added several new positions in this weekend’s edition. Trade better and longer with more energy and vigor. Visit my Health Page.

NYAD Remains in Consolidation Pattern
The New York Stock Exchange Advance Decline line (NYAD) remains above its 50-day moving average and continues its steady consolidation. This is reassuring, especially in the presence of extreme Fear from investors.

The Nasdaq 100 Index (NDX) crashed below 21,000 and is oversold enough for a bounce. As with QQQ we need to see what happens in the next few days.

The S&P 500 (SPX) fell below 6000 and its 50-day moving average. It too is ready for a bounce. How the bounce develops is the key to what happens next.

VIX Crosses Above 20
The CBOE Volatility Index (VIX) is hovering near 20. A further rise would be bearish for stocks.
VIX rises when traders buy large volumes of put options. Rising put option volume leads market makers to sell stock index futures to hedge their risk and leads markets lower. A fall in VIX is bullish signaling lower put option volume, eventually leads to call buying which is bullish as it causes market makers to buy stock index futures raising the odds of higher stock prices.
To get the latest up to date information on options trading, check out “Options Trading for Dummies”, now in its 4th Edition – Available Now!
#1 Best Seller in Options Trading –

Now in Audible Audiobook Format
Options Trading for Dummies (4th Edition) Audible Audiobook – Unabridged
Joe Duarte MD (Author), Terrence Kidd (Narrator), Tantor Audio (Publisher)
4.5 out of 5 stars