


Stuck in Neutral Ahead of the Fed: An Invisible Furnace Prepares to Enter the Tangible Realm.
A significant decision point looms for stock traders.

At first glance Wall Street is stuck in neutral. But don’t let that fool you. The potential for an explosive move is building. Think of the current market as one in which there is an invisible furnace in the center of the office which is ready to enter the realm of the tangible realm at any moment.

Image courtesy of craiyon.com
Familiar readers are aware that the action three weeks ago seemed like a washout which set up the bounce we’ve experienced since then. And while the rally has been rewarding in the short term, there are still plenty of reasons not to be fully bullish. Moreover, given the complexity of the geopolitical situation and the state of the global economy ahead of the Fed’s FOMC meeting (1/28-1/29) during earnings season, just about anything can happen, sooner rather than later.
The majority view seems to be that the Fed won’t be lowering rates in the short term as inflation is still a concern, although last month’s CPI, PPI, and PCE numbers were better than expected. Unfortunately, recent PMI data suggests that inflation is still ticking up. Moreover, as I noted here, the effects of the California fire on food prices are uncertain, especially when cattle herds are decreasing and there is large bird flu problem affecting the egg supply.
But things can change to the upside if earnings deliver positive surprises or some of the geopolitical uncertainties align on the right side of expectations (whatever the algos are programmed to like). They can also turn down in a hurry, especially if the Fed sours further on rate cuts or some other Black Swan appears out of nowhere. So, what’s the best posture for this market? Stick with what’s working but be prepared for volatility and uncertainty interspersed with positive surprises.
Stuck in Neutral Near the Furnace
The reliable indicators we’ve relied on for years are flashing the big Neutral, with the potential for a big explosion rising. Here are the details:
• The CNN Greed/Fear Index (GF) closed at 48 on 1/24/25 after registering a bullish reading of 27 right before the rally.
• The Put/Call ratio xxx after reaching its recent highs just above 1.0 in early 2025. The prior meaningful market bottoms, which led to long term rallies followed P/C ratios of 1.25 (8/24) and 1.30 (11/24). As with the GF index, a slow descent in this ratio offers the rally durability.
• The S&P 500 (SPX) delivered a new high and the Nasdaq 100 (NDX) is close to achieving a similar milestone. The RSI for both rolled over suggesting upside momentum is waning.
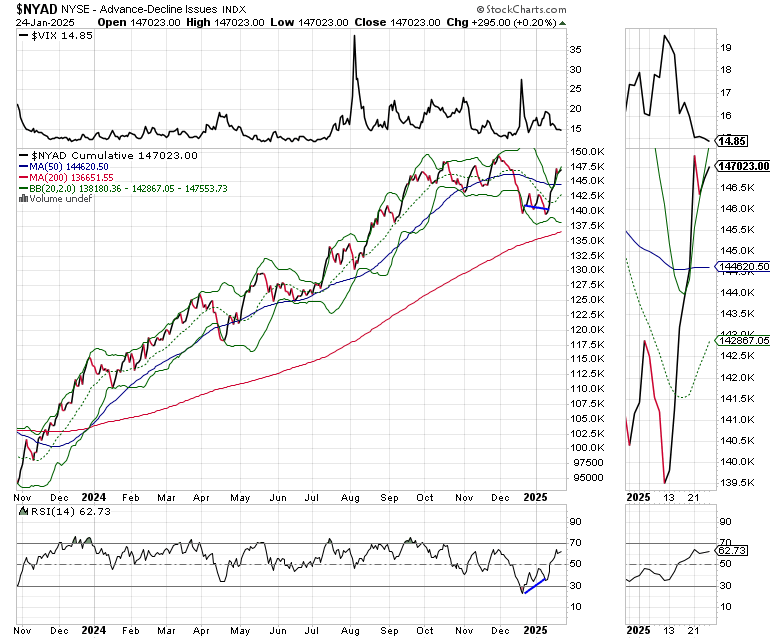
• The New York Stock Exchange Advance Decline line (NYAD, see below for full details) is above its 50-day moving average but just shy of a new high while simultaneously bouncing around its upper Bollinger Band. This is a minor divergence and is of some concern.
Bottom line: The rally is pausing but can just as easily be reignited if positive surprises develop. It can also deliver a nasty reversal if things line up on the wrong side of the fence.
Bond Market Echoes the Big Neutral Ahead of the Fed
It just doesn’t get more neutral than this, as the bond market is echoing the neutral stance of the stock market.

The U.S. Ten Year Note yield (TNX) is just below its 20-day moving average and the 4.6% yield area with the RSI just above 50. Note the Bollinger Bands are starting to close in, suggesting that a big move is setting up. In other words, when the Fed makes its move bond traders will come off the sidelines; possibly aggressively.
Commodities Rock – NVIDIA Flounders
Commodities are flaring up, especially in the ag sector.
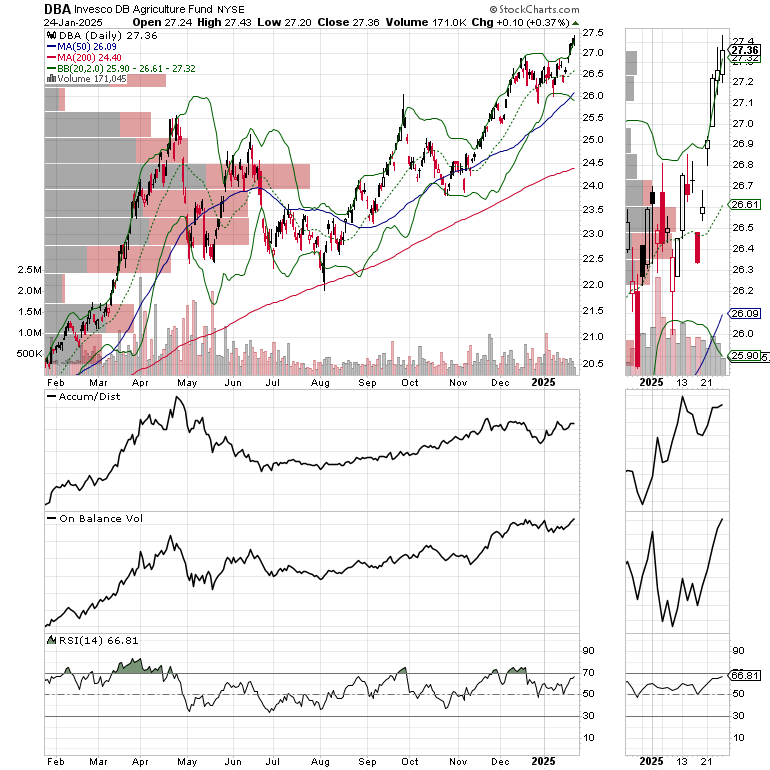
The action in the Invesco DB Agriculture Fund (DBA) speaks for itself and supports the notion that food prices may be the fly in the ointment for future inflation readings. DBA’s new high has been partially fueled by a rally in coffee, corn, and cocoa.

The push toward rebuilding in North Carolina, California, and perhaps Ukraine (should peace emerge) has created interest in infrastructure stocks. The FlexxShares Stoxx Global Broad Infrastructure Index Fund (NFRA) is showing some strength, rebounding above its 50 and 200-day moving averages.

Meanwhile, the Granite Shares 2X Long NVDA Daily ETF is flashing a warning sign with an ominous looking bearish engulfing pattern as short sellers sneak in (toppy looking ADI) and buyers walk away (sluggish OBV).

For its part, the iShares U.S. Home Construction ETF remained off its recent bottom. Recent earnings from Lennar (LEN) and D.R. Horton (DHI), although flat to slightly worse than the prior year’s, were better than expected while guidance suggested a cautious but hopeful tone. Expect ITB’s next move to be in reaction to the Fed and the bond market. I’ve been adding housing stocks cautiously to both my long term focused Weekender Portfolio, and the more aggressive short term oriented Smart Money Passport lately. For ETF trades, check out the Sector Selector portfolio.
Liquidity Remains Bullish
Liquidity, the ease with which money travels through the financial system is the key to bull and bear markets. When liquidity is ample, markets tend to rise. When liquidity is scarce markets don’t do well. The Federal Reserve’s National Financial Conditions Index (NFCI) is a readily available tool which indirectly shows us the state of liquidity in the markets.
A decline in the weekly NFCI number indicates that the ease with which money can be borrowed is rising. Last week, NFCI again moved lower. This is a positive for stocks.
Bitcoin Knocks on Door of Breakout
Bitcoin (BTCUSD) remains the verge of a major breakout with the $100,000 level becoming a dip buying point.

You can check out my latest Bitcoin trade at the Smart Money Passport. If you’re an ETF trader, consider, Joe Duarte’s Sector Selector. It’s FREE with your monthly membership to Buy Me a Coffee. Sign up here. If you’ve been thinking about starting a day trading career, my new book “Day Trading 101” will get you started on the right foot. For steady gainers, check out the Smart Money Weekender Portfolio. I’ve just added several new positions in this weekend’s edition. And if you’re looking cut your stress and trade more effectively, visit my Health Page.

NYAD Walks a Tight Rope
The New York Stock Exchange Advance Decline line (NYAD) is within reach of a new high but walking a tight rope around its upper Bollinger Band. RSI is well below 70, which is bullish unless it collapses below 50 which would signal a loss of momentum.
The Nasdaq 100 Index (NDX) is closing in on 22,000 but looks a bit tired. ADI and OBV seem to be softening as profit taking takes over in the short term.

The S&P 500 (SPX) is above the 6000 level, which is now short term support. The 50-day moving average is now support. Volume on up days is dwarfing volume on down days. This is a short term positive.

VIX Falls Well Below 20
The CBOE Volatility Index (VIX) is well below 20
VIX rises when traders buy large volumes of put options. Rising put option volume leads market makers to sell stock index futures to hedge their risk and leads markets lower. A fall in VIX is bullish signaling lower put option volume, eventually leads to call buying which is bullish as it causes market makers to buy stock index futures raising the odds of higher stock prices.
To get the latest up to date information on options trading, check out “Options Trading for Dummies”, now in its 4th Edition – Available Now!
#1 Best Seller in Options Trading –

Now in Audible Audiobook Format - 4.5 Stars
Options Trading for Dummies (4th Edition) Audible Audiobook – Unabridged
Joe Duarte MD (Author), Terrence Kidd (Narrator), Tantor Audio (Publisher)